September 2026 CPI: inflation hit 3.7% on October 14, and stocks, yields and gold moved within a minute
Core prices beat the forecast, gasoline rose 9.1%, and Nasdaq 100 futures fell 0.632% in the first minute after the 8:30 a.m. release.
- Consumer prices rose 0.6% in September 2026 and 3.7% on the year, against a 3.6% forecast; core rose 0.3% on the month against 0.2% expected.
- Gasoline rose 9.1% in the month and accounted for more than half of the increase in the all-items index.
- In the first minute after the release Nasdaq 100 futures fell 0.632%, 10-year note futures 0.521% and spot gold 0.592%, measured by MoveSurge.

Reaction by asset (real prices)
| Asset | 2m before | At release | +1m | +10m | +1m % | +10m % |
|---|---|---|---|---|---|---|
| US100 | 30839.75 | 30839.75 | 30644.75 | 30601.25 | -0.63% | -0.77% |
US consumer prices rose 0.6% in September 2026 and 3.7% from a year earlier, above the 3.6% economists expected, and core prices rose 0.3% on the month against a 0.2% forecast. The Labor Department released the report at 8:30 a.m. ET on Wednesday, October 14, and it reached the MoveSurge news feed at 08:30:12 ET. In the first minute Nasdaq 100 futures fell 0.632%, 10-year Treasury note futures fell 0.521% as yields rose, and spot gold dropped 0.592%.
The monthly headline figure matched the forecast, so the surprise sat in the annual rate and in core prices. Gasoline rose 9.1% in the month and accounted for more than half of the increase in the all-items index, while shelter rose 0.4% after 0.3% in August.
The September CPI numbers
| September 2026 | Forecast | August 2026 | |
|---|---|---|---|
| CPI, month on month | 0.6% | 0.6% | 0.4% |
| CPI, year on year | 3.7% | 3.6% | 3.4% |
| Core CPI, month on month | 0.3% | 0.2% | 0.3% |
| Core CPI, year on year | 2.6% | 2.5% | 2.4% |
Energy prices rose 5.2% in the month and 20.4% over the year, and gasoline was up 34.2% from September 2025. Food prices were flat on the month. Average hourly earnings adjusted for inflation fell 0.5% in September and 0.7% over the year, because nominal pay rose 0.1% while prices rose 0.6%.
How markets moved in the first ten minutes
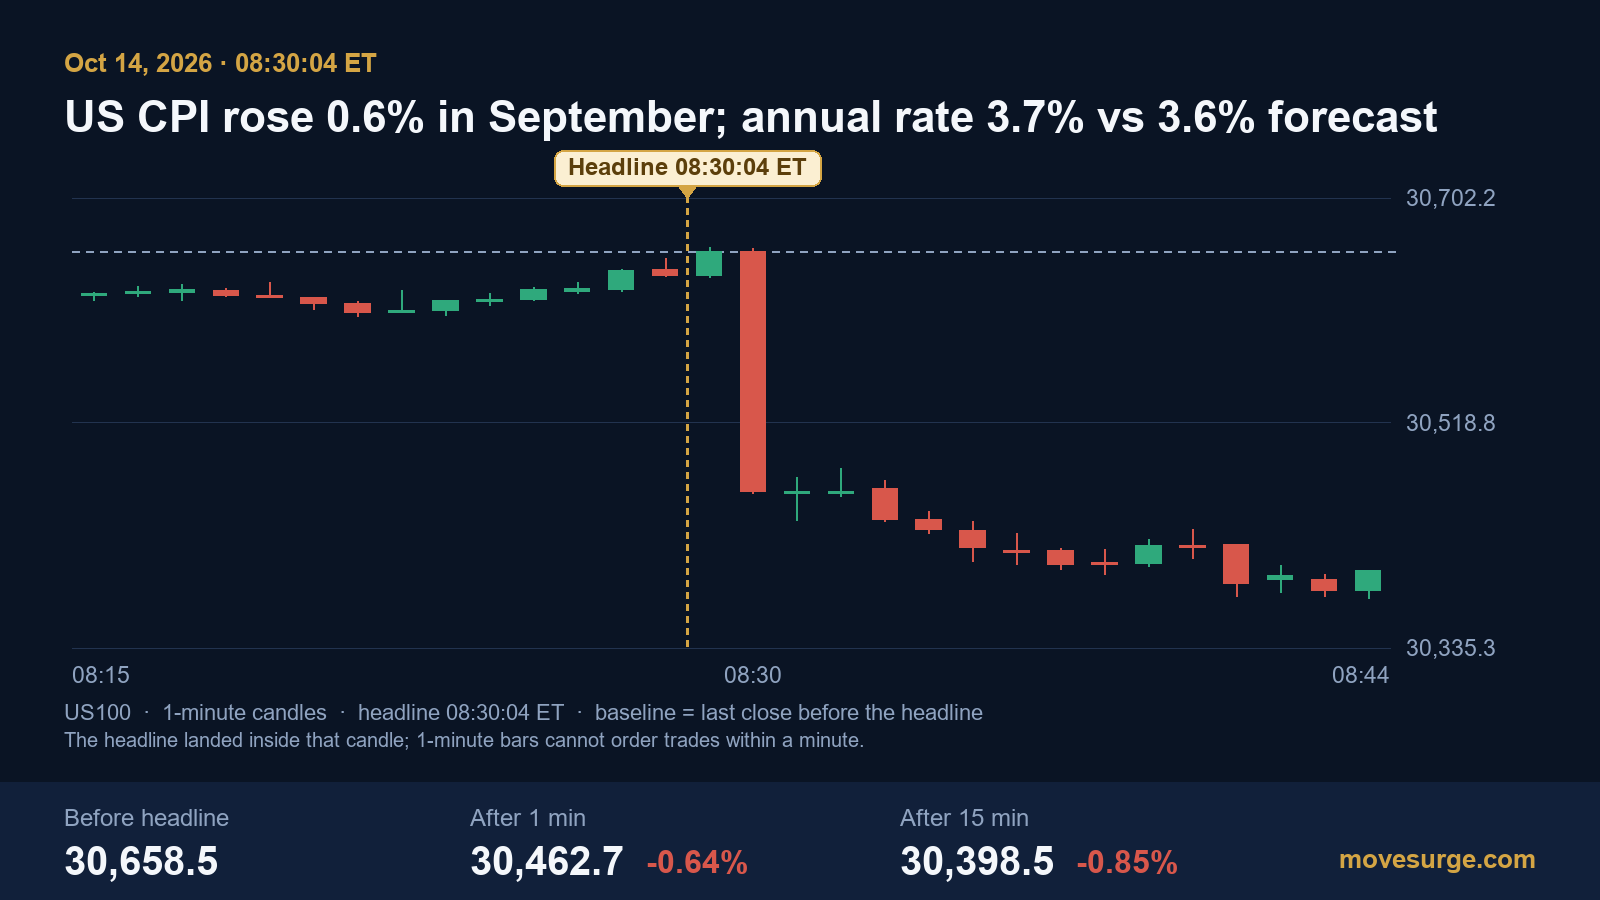
The one-minute candles put Nasdaq 100 futures at 30,462.7 at the end of the first minute, down 0.64% from 30,658.5, and at 30,398.5 after fifteen minutes, down 0.85%. The MoveSurge reaction reading, taken from the futures contract, recorded a 0.632% fall after one minute and a 0.773% fall after ten.
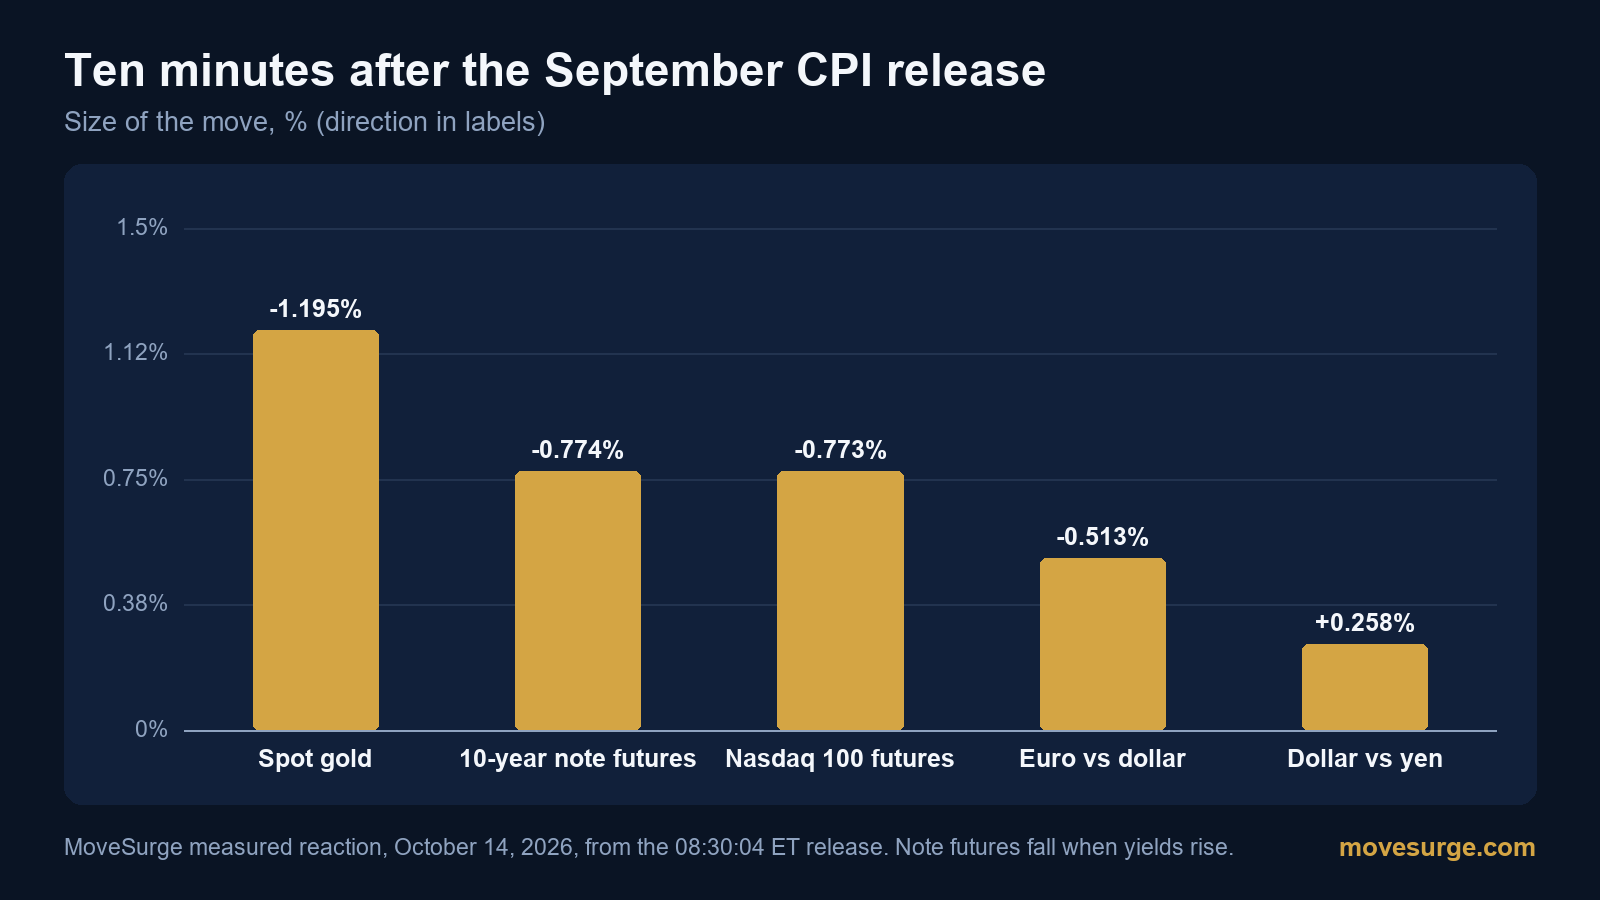
| Market | After 1 minute | After 10 minutes |
|---|---|---|
| Nasdaq 100 futures | -0.632% | -0.773% |
| 10-year Treasury note futures | -0.521% | -0.774% |
| Spot gold | -0.592% | -1.195% |
| Euro against the dollar | -0.347% | -0.513% |
| Dollar against the yen | +0.21% | +0.258% |
Gold fell more than any other market in the table, even though the report showed faster inflation. Traders read the print as raising the chance of another Federal Reserve rate increase, which pushed up yields and the dollar, and gold pays no interest, so a higher expected rate path makes it less attractive to hold. Short-term interest-rate futures fell within a minute of the release as traders added to bets on an October hike. Note futures and yields move in opposite directions, so the 0.774% fall in the 10-year contract after ten minutes was a rise in the yield.
The close on October 14
The S&P 500 closed down 1.11% at 7,718.94, its largest one-day fall since July 29, and the Nasdaq Composite fell 1.88% to 26,692.87, its biggest drop since July 23. The Dow lost 0.09%. Chip stocks did most of the damage: the Philadelphia Semiconductor index fell 4.3%, Oracle 8.8% and Dell 11.27%. The dollar index rose 0.69% to about 102.90, an 18-month high, and November WTI crude settled up 1.01% at $95.09.
What it means for the Fed
The Fed raised its target range by a quarter point to 3.75% to 4.00% on September 16, its first increase since July 2023, and its next meeting is on October 27 and 28. Futures pricing put the chance of an October hike at about 37% at the close, according to CME FedWatch data cited by Reuters. San Francisco Fed President Mary Daly said that day further increases were likely needed but not urgently, and attributed most of the jump in the headline rate to gasoline. Chicago Fed President Austan Goolsbee called the report discouraging. The minutes of the September meeting, released a week earlier, showed most officials expected another increase by the end of 2026. On October 7 the 10-year yield had already climbed to its highest level since 2002.
What was the US CPI for September 2026?
Consumer prices rose 0.6% on the month and 3.7% on the year, against a 3.6% annual forecast. Core CPI, which excludes food and energy, rose 0.3% on the month and 2.6% on the year.
Why did gold fall after a hot CPI report?
The report raised expectations of another Fed rate increase, which lifted yields and the dollar. Spot gold, which pays no interest, fell 0.592% in the first minute and 1.195% after ten minutes, measured by MoveSurge.
How much did stocks fall on October 14, 2026?
The S&P 500 fell 1.11% and the Nasdaq Composite 1.88%, their largest daily falls since late July. Nasdaq 100 futures were down 0.632% one minute after the 8:30 a.m. ET release.
When is the next CPI report?
The October 2026 CPI is scheduled for November 10, 2026 at 8:30 a.m. ET.
Sources
-
Consumer Price Index Summary, September 2026
— US Bureau of Labor Statistics
CPI rose 0.6% in September and 3.7% over the year; core rose 0.3%; gasoline rose 9.1% and accounted for more than half of the monthly increase; shelter rose 0.4%.
-
Real Earnings, September 2026
— US Bureau of Labor Statistics
Real average hourly earnings fell 0.5% in September and 0.7% over the year.
-
CPI inflation report September 2026
— CNBC
The annual rate of 3.7% compared with a 3.6% Dow Jones forecast; core 2.6% against 2.5%; gasoline up 34.2% over the year.
-
How major US stock indexes fared Wednesday 10/14/2026
— Associated Press via ABC News
S&P 500 fell 1.11% to 7,718.94, Nasdaq fell 1.88% to 26,692.87, Dow fell 0.09%.
-
Nasdaq suffers biggest daily drop since July as inflation heats up
— Reuters via Honolulu Star-Advertiser
Largest S&P 500 fall since July 29 and Nasdaq drop since July 23; chip index down 4.3%; October hike odds about 37% at the close.
-
Federal Reserve issues FOMC statement
— Federal Reserve
The FOMC raised the federal funds target range to 3.75% to 4.00%.
-
Fed's Daly says rate hike not urgently needed
— Reuters via The Star
Daly said further hikes are likely needed but not urgently and linked the headline jump mostly to gasoline.
-
US Dollar Index roars towards 103 as hot CPI reignites Fed hike bets
— FXStreet
The dollar index rose 0.69% to about 102.90, an 18-month high.
Never miss the next market-moving story
Follow the core market-moving feed across equities, macro, currencies and commodities. Your subscription includes price moves after the news, search, watchlists, alerts and research tools.
Create free accountGo real time Watch live headlines -- free